By Michael Collins, Managing Director, EquiNova
September 2022
Like you, I scrutinize lots of charts in search of investment insights. Below you’ll see some of the favorite ones that I’ve come across lately, along with my views of both the obvious and subtle messages that lie within. What do you see in these numbers? Tell me.

How Busy Is M&A for Window, Door Companies?
On Sept. 27, I presented to the Fenestration & Glazing Industry Alliance the results of EquiNova’s research into acquisitions and expansions involving window and door manufacturers as well as our summary of economic and industry trends. You can watch the presentation here. Among the slides (ask me for a copy of the whole presentation) were the two above. The one on the left shows we have had 470 acquisitions of window and door makers since 2000. Strategic buyers figured in 76% of those transactions, private equity buyers in the rest.
The right-hand chart, meanwhile, records the 207 expansions this century by window and door makers, 13% of which occurred in the past two years. Plant closures–other than combining plants–are largely a thing of the past. I told the audience that M&A activity in this sector has remained steady, despite prevailing sentiment that tax codes won’t change this year or next. Higher interest rates will have a dampening effect, I added, but most buyers are flush with cash and have some of the strongest balance sheets they’ve shown in years.
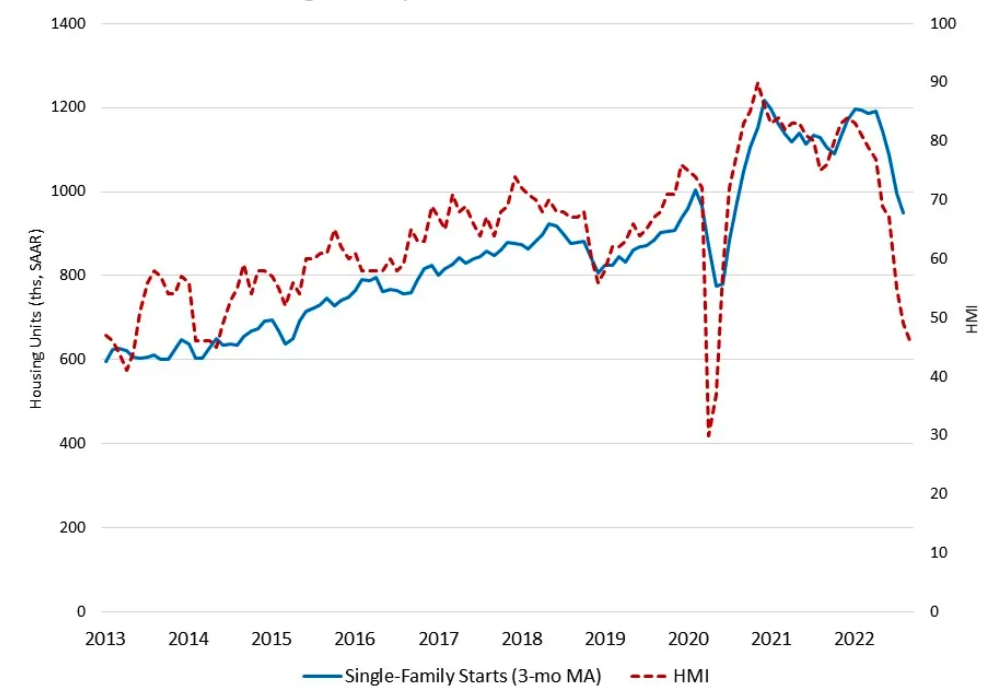
Builders’ Mood Swings
The media has made a big deal lately about builders’ plunge into pessimism in the latest NAHB/Wells Fargo Housing Market Index. The mood is shown in the blue line above. Changes in actual starts are marked by the dotted red line.
We definitely should pay attention to builder attitudes, and surveys by groups like Zonda show builders do anticipate reducing starts in 2023. But note how the builder index consistently rises higher and falls lower than the actual starts numbers. Thus, when you hear about builders’ mood “plummeting,” keep in mind the actual decline in starts might not merit that description.
Dealers’ Hiring Practices Are Evolving
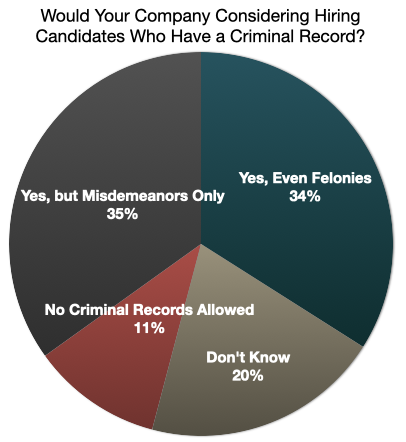
These numbers at right are a sort of Rorschach test for the construction supply industry. They’re drawn from a recent survey of more than 200 LBM Journal subscribers in which more than two-thirds of the respondents said their company would consider hiring a candidate who had a criminal record. You could say these numbers show that building material dealers are much more willing to give a person a second chance by taking on someone who might have gotten into trouble with the law. You also could read these numbers as an indication of how desperate dealers are to find workers. They fit in with other reports we’re hearing of dealers using prisoners on work-release programs as employees in their manufacturing operations. Meanwhile, a new book is out from the owner of a $50 million hardware store chain who regularly hires recovering drug addicts. She also doesn’t bother to ask if the applicant has a criminal record.
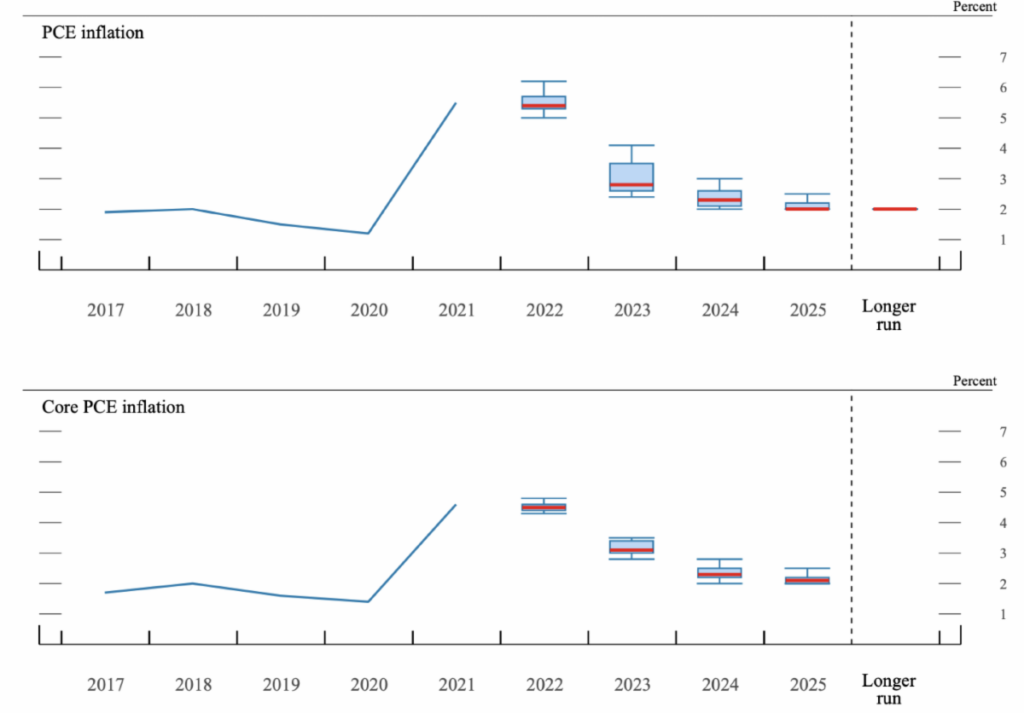
It’s A Long Road Down To 2% Inflation
You often will hear commentators and guests on financial news show discuss the Federal Reserve’s “bitmap.” They’re referring to these relatively simple graphs above showing the central bank’s inflation expectations in coming years. The red lines matter most here: They indicate where the Fed believes the Personal Consumer Expenditure inflation rates (overall inflation in the top chart, inflation excluding food and energy price changes in the lower chart) will be each year out to 2025. We’re at about a 6% inflation rate now, and the Fed wants to get that annual change to 2%. Many experts believe we’ll do that only if the nation falls into a recession. Fed Chairman Jerome Powell won’t give odds on that. But this chart shows that he believes we’ll be dealing, at least through 2025, with higher interest rates than we experienced any time last decade.
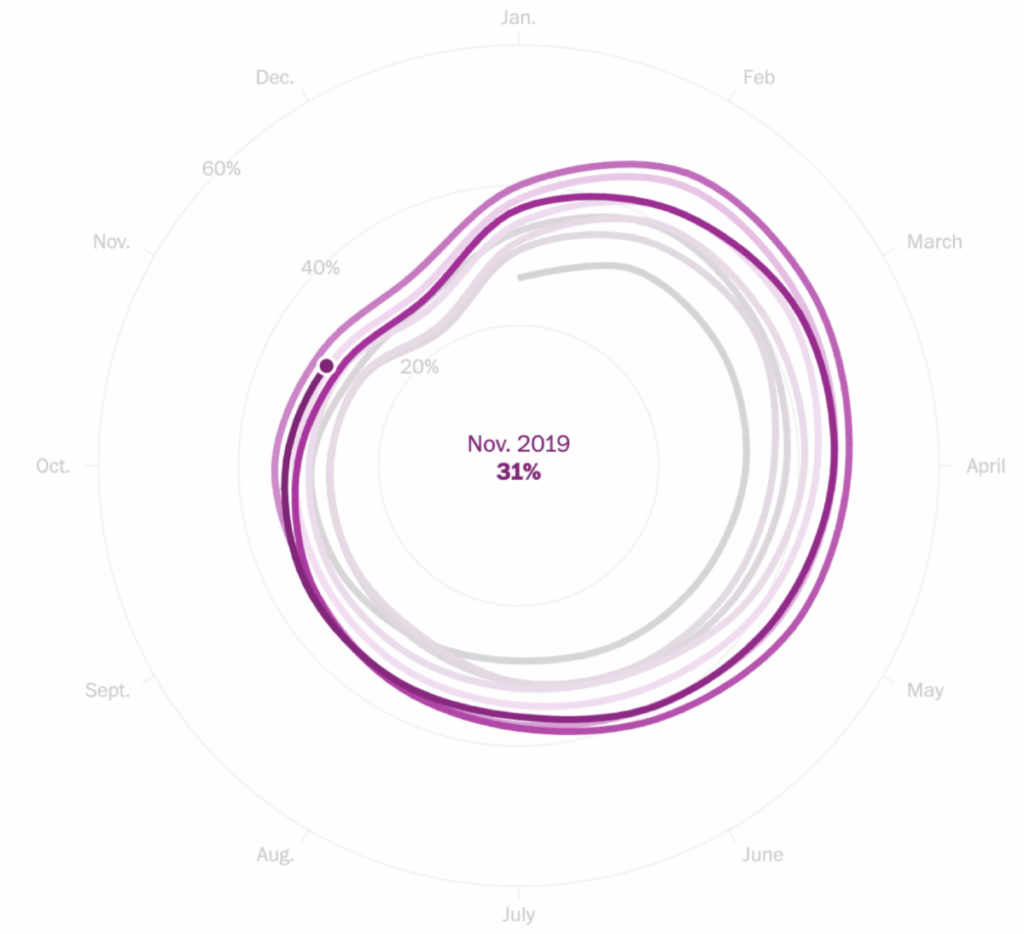
A New Perspective On The Cooling Market
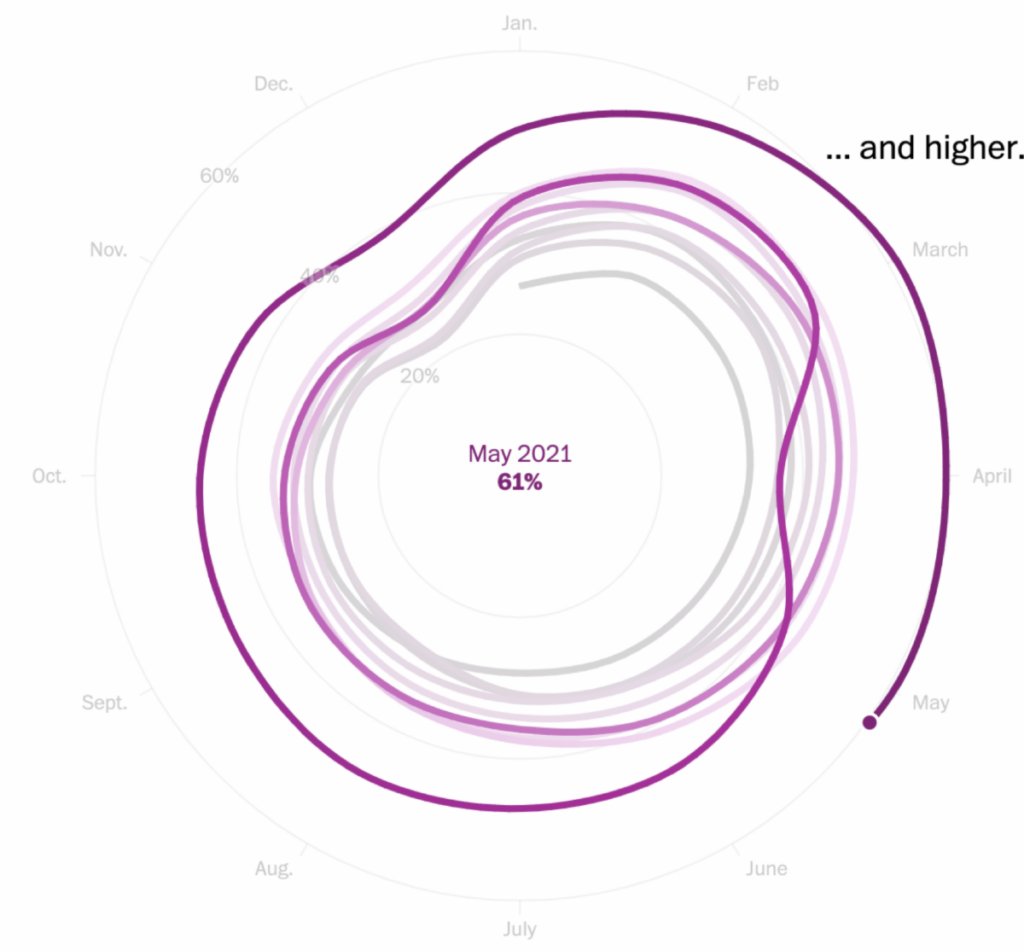
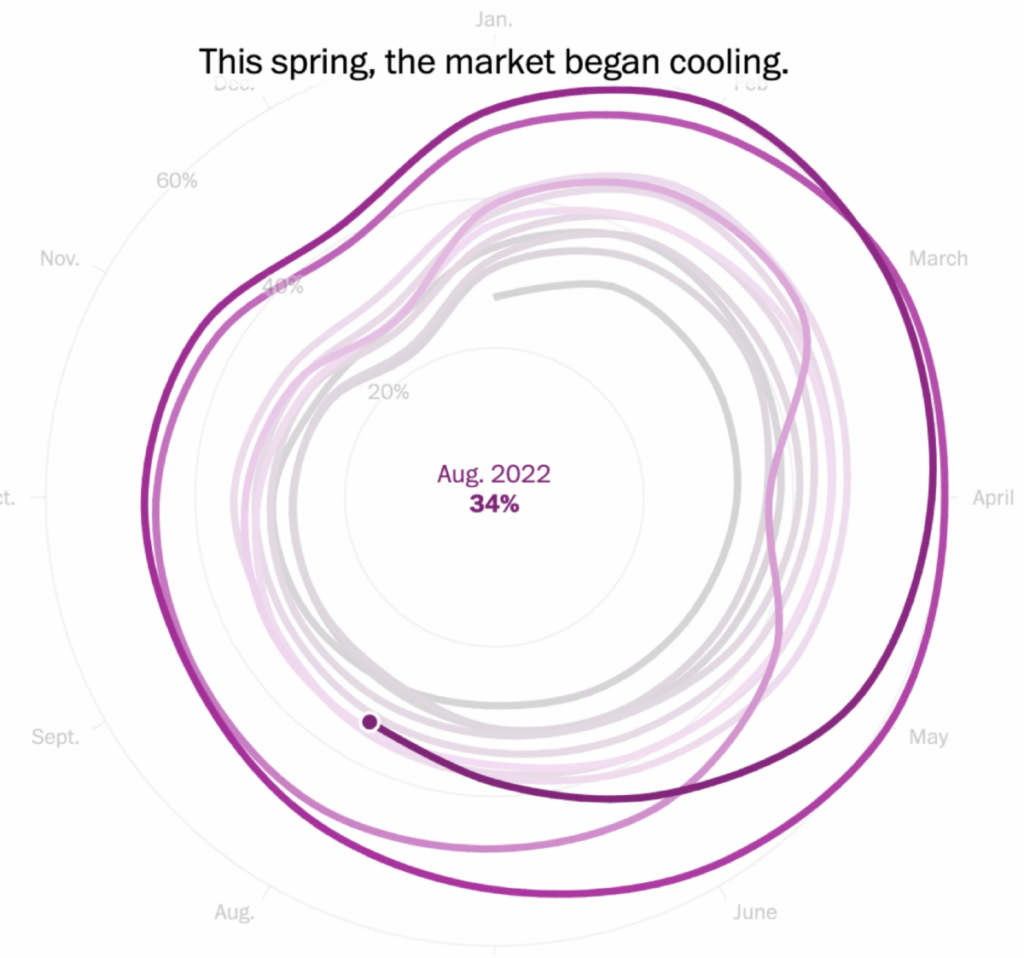
One of the most creative uses of graphics we’ve seen lately is an interactive chart The Washington Post created. It was meant to show how housing demand had cooled recently. But in doing so, it also showed that this cooling is merely bringing us back to normal, not into a deep freeze.
The chart shows, month by month since 2012, one of the most common measures of housing demand: The percentage of homes that sold within two weeks of going on the market. The data from Redfin reveals that this average hovered between 27% and 31% every month from 2012 through 2019 (left-hand chart above). Then COVID struck and demand for homes shot up. By May of 2021, the percentage of homes selling within two weeks had risen way beyond the norm, all the way to 61% (middle chart). But since then, the share of homes selling within two weeks has fallen–but only to 34% as of August (right-hand chart). Even if the percentage keeps dropping, it’s likely to be only about where it was most of the previous decade.
Busy As Florida Is, It’s Still Underbuilt…
Measured by starts, Florida has five of the 20 busiest markets in the country. Its builders are bringing in trusses from as far away as the Pacific states. But that doesn’t mean the Sunshine State is heading into the same problem of having too many houses that it had during the Great Recession.
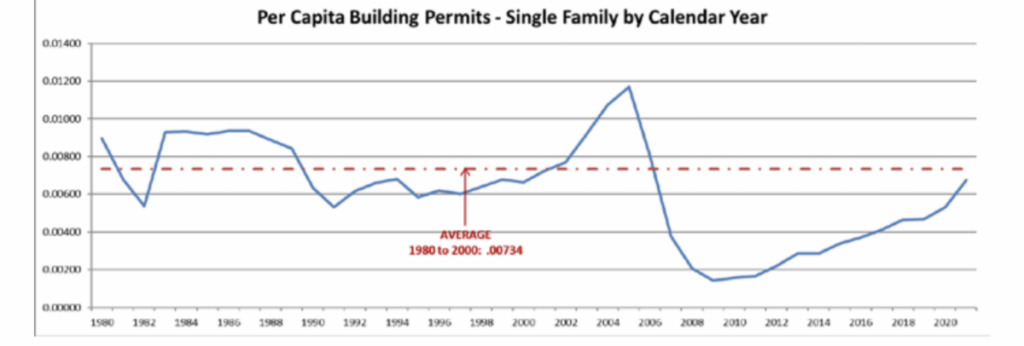
The chart above, provided by researchers for the Florida Legislature, measures building permits on a per-capita basis. It suggests that, after being dramatically overbuilt heading into the recession last decade, Florida ever since has built far fewer homes than are needed to satisfy the rapidly growing population. So long as people keep moving in from elsewhere, Florida is sure to remain one of the nation’s hottest markets.
…Though A Global Recession Will Hurt
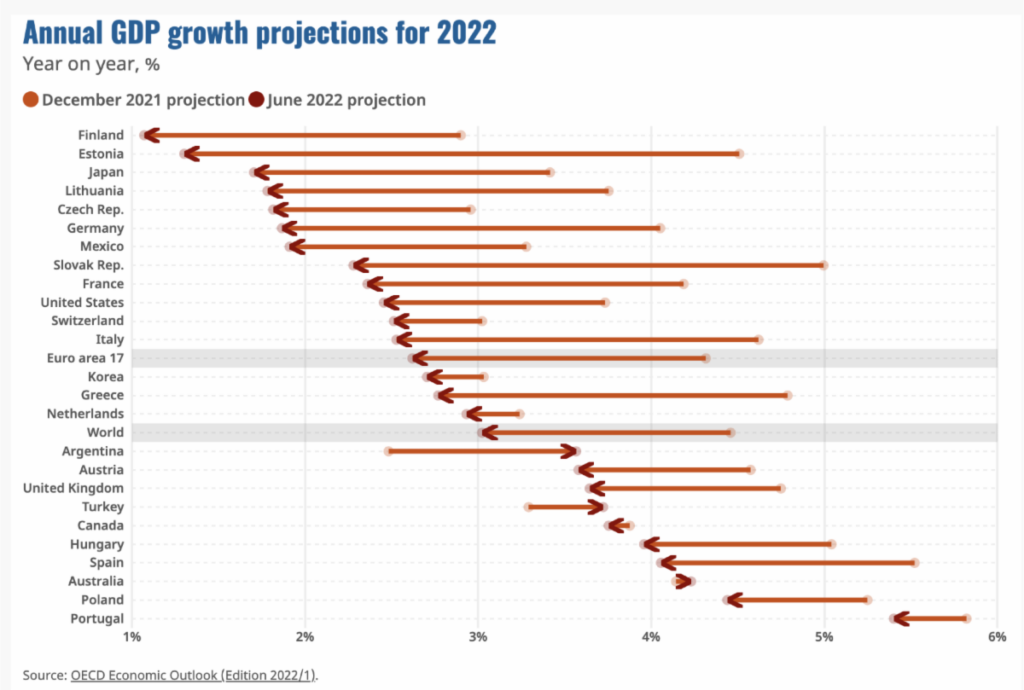
Nearly one-quarter of the $59 billion that foreigners spend on housing in the United States goes to buy homes in Florida. That makes Florida more sensitive than other states to the global economy. And, as shown by this chart from the Organization of Economic Cooperation and Development (an organization for mainly rich countries), just about every country on the list is seeing a slowdown in its economic growth from what was predicted last December.
There’s another factor to consider, too: The strength of the dollar makes U.S. housing even more expensive when measured in other currencies. You can expect that Miami-Dade, Naples, and Orlando think about this the most, since they are the areas most sought after by foreign buyers.
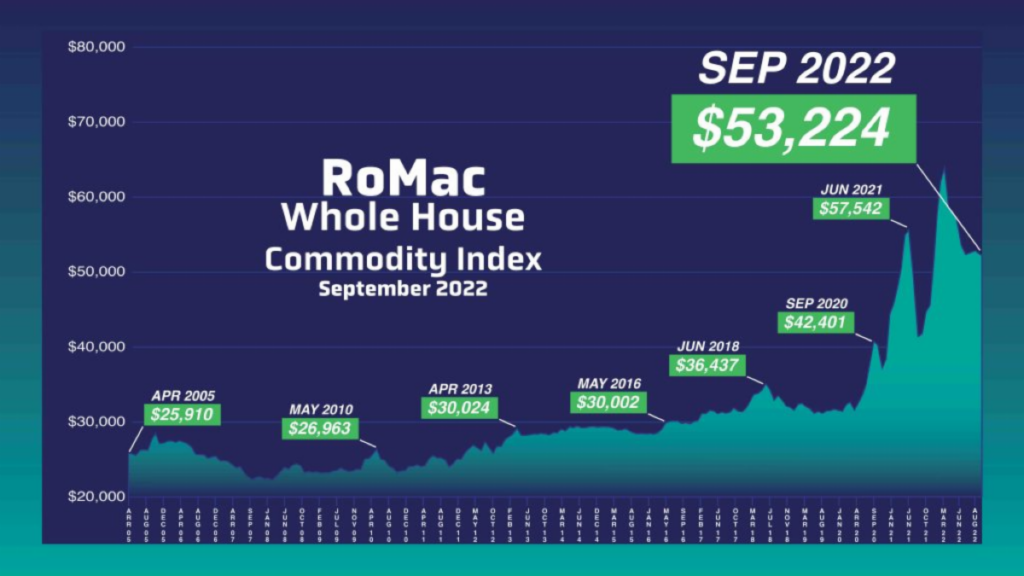
Lower Material Prices Could Reveal Problems
Many construction supply companies nationwide publish charts like this, showing how much it costs to buy the materials needed to build an average-sized house in that dealer’s market. The chart above, taken from a dealer based in Florida, shows what is likely to be the case nationwide. Recent drops in some materials–particularly lumber–have cut the price of building a house a bit lately, even if the overall price still is far above where it was pre-COVID. Builders FirstSource has told investors that, depending on the price of lumber, it’s annual sales this year could be anywhere between $16 billion and $26 billion.
For investors, there are two implications here. First, the sales volume for many lumberyards (especially those that didn’t make acquisitions) is likely to be lower this year than it was in 2021, simply because the quantity of lumber sold brought in fewer dollars. And second, if those same dealers gave raises to employees, their 2022 profit margins are likely to be challenged.